NOVA HUB’s ROI depends on location-driven demand, modern warehouse standards, and professional management. Build a detailed model that includes rents, vacancy, operating costs, financing, and exit value. Compare conservative and optimistic scenarios to judge payback and IRR, then align the project with your risk profile and long term strategy.
What is the expected ROI for NOVA HUB and how to calculate it?
The expected return on investment for NOVA HUB is formed by a mix of rental income, capital appreciation of warehouse space, and the quality of professional management. To estimate ROI, investors should model purchase price, operating costs, lease rates, vacancy, and exit value, then compare several scenarios based on realistic data for the Odesa logistics market.
The Ukrainian warehouse sector is transforming rapidly as supply chains are rebuilt, trade corridors shift toward the Odesa–Kyiv axis, and dry ports gain importance. From an investor’s perspective, the main challenge is not finding opportunities but correctly quantifying risk and profitability for each logistics investment in Ukraine. That is where disciplined ROI calculations for a specific asset such as NOVA HUB become essential.
This article explains how to evaluate the profitability of a warehouse complex step by step. You will learn how to read project characteristics, structure cash flow models, calculate basic and advanced ROI metrics, compare scenarios, and avoid typical mistakes. We will also look at practical examples tailored to an investment project in Odesa with European quality standards and professional facility management.
📌 What makes NOVA HUB financially attractive as a logistics investment in Ukraine?
Before running numbers, investors need to understand which project features drive revenue, reduce risk, and support long term value growth.
Strategic location on the Odesa–Kyiv corridor
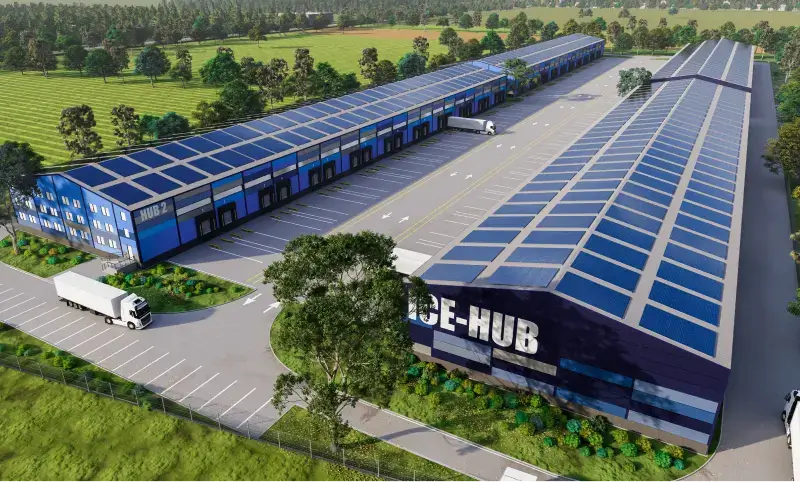
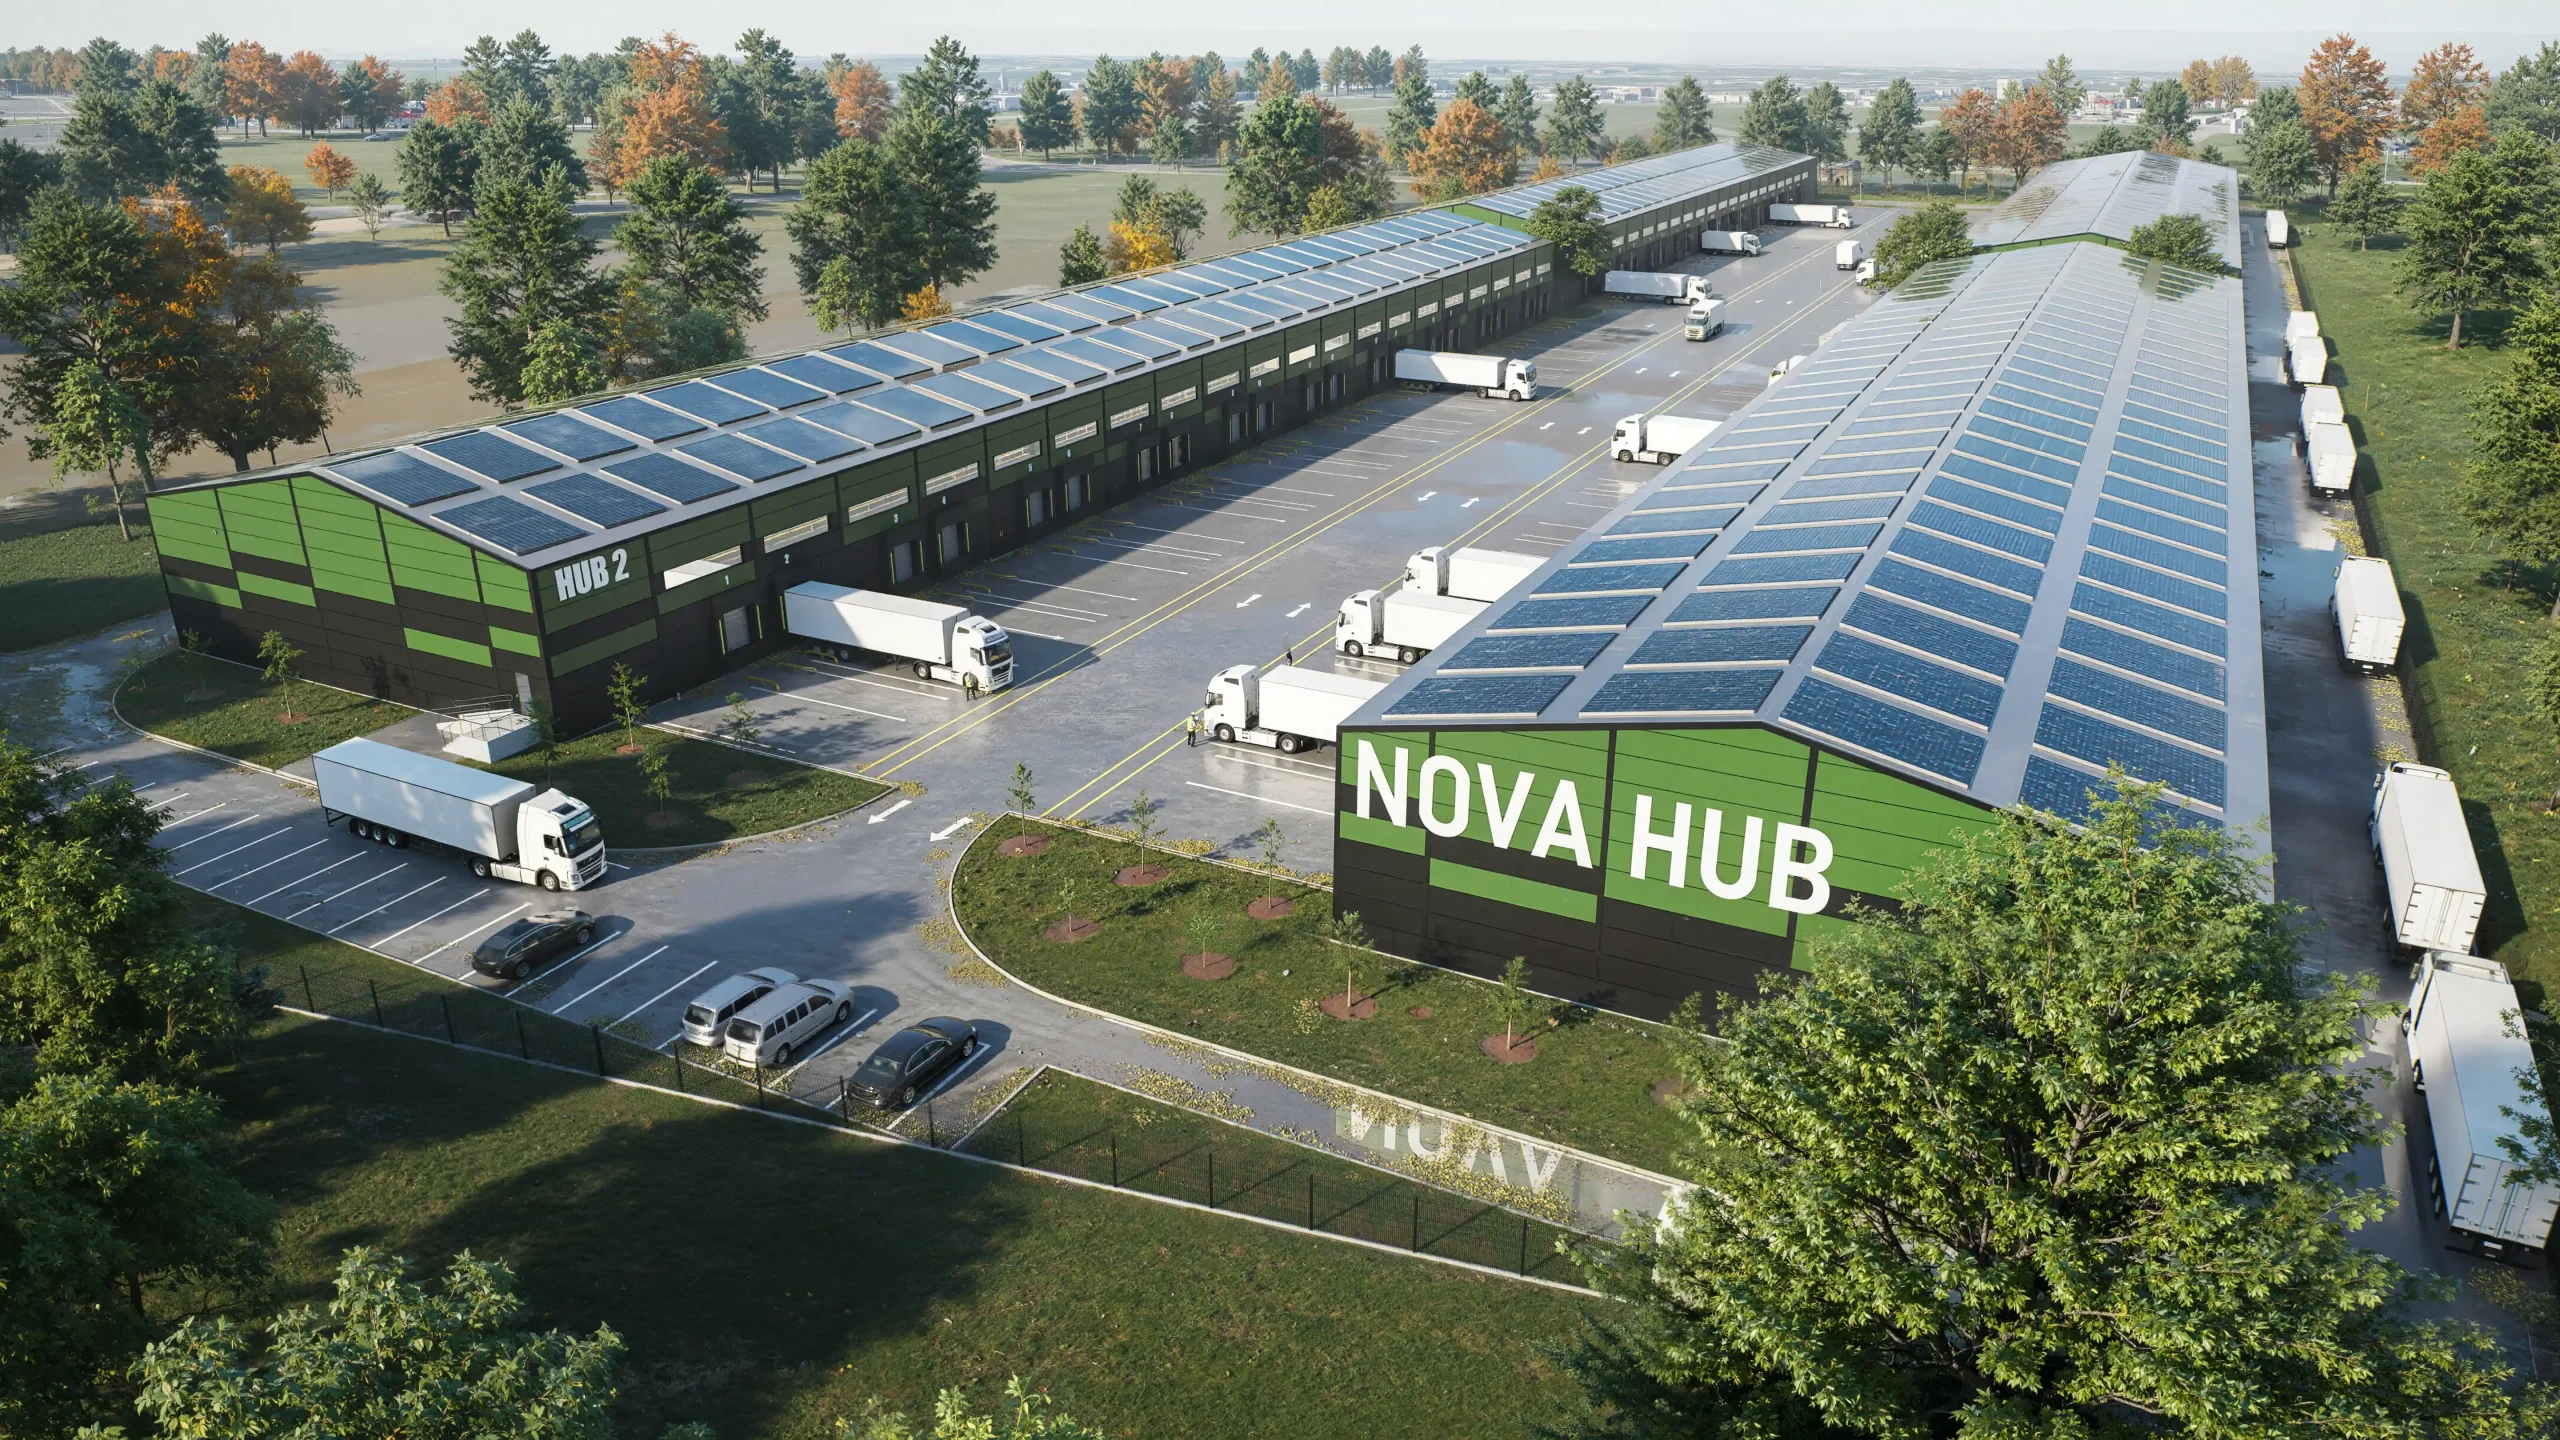
NOVA HUB is situated on the key route between Odesa and Kyiv, close to a dry port and main transport arteries. This location supports multimodal flows of containers, road freight, and regional distribution for both importers and exporters. Proximity to ports and highways usually translates into higher occupancy and more stable rental demand.
In brief, strong transport connectivity reduces logistics costs for tenants, so they are ready to pay a premium rent for modern space in a well planned hub.
Modern warehouse specifications and European standards
The complex is designed as a contemporary Class A type facility that follows European construction and safety standards. High clear height, optimized column grid, sufficient floor load, and dock doors directly impact operational efficiency for logistics operators, 3PLs, and e-commerce companies.
Prospective investors can review technical parameters such as total leasable area, types of premises, and expected yield in the project’s core characteristics section. These figures provide the base for income and cost calculations.
Professional management by SK GROUP
SK GROUP handles the professional management and maintenance of NOVA HUB. For investors this means centralized leasing, technical servicing, and financial control of the asset. Professionally managed logistics centers typically have lower vacancy, more predictable expenses, and higher tenant satisfaction.
The key takeaway is that strong management quality can add several percentage points to your effective ROI by minimizing downtime and unplanned repairs.
Transparent investment advantages and planning
NOVA HUB offers structured information for potential investors, including summarized investment advantages and a clear master plan. The advantages overview describes project benefits such as location, standards, and flexibility of commercial spaces. The master plan view shows how the logistics center is organized, which is important for traffic flow, zoning, and expansion potential.
All these factors influence achievable rents, cost efficiency, and long term capital growth of the asset, which must be reflected in the ROI model.
📊 Which ROI metrics should investors use for NOVA HUB?
Different investors focus on different indicators, yet a complete analysis should combine several complementary metrics.
Simple ROI and payback period
Simple ROI compares annual net profit to the total invested capital. It gives a quick sense of profitability for the warehouse complex. The payback period shows how many years of net income are needed to recover your initial investment, without considering discounting.
For example, if an investor pays 5 million USD for space in a logistics center and receives 500,000 USD in net income per year, simple ROI is 10 percent and payback is 10 years. These measures are easy to communicate but do not include the time value of money or exit value.
Net Present Value (NPV)
NPV discounts all future cash flows from the project at a required rate of return, then subtracts the initial investment. A positive NPV means that the project generates more value than a comparable alternative with a similar risk level. For logistics investment in Ukraine, discount rates are usually higher than in Western Europe to reflect country and market risk.
To summarize, NPV shows whether the expected stream of rental income and eventual sale proceeds justify the capital you put into NOVA HUB at your chosen risk premium.
Internal Rate of Return (IRR)
IRR is the discount rate at which NPV becomes zero. In practical terms, it is the annualized rate of return the project is expected to generate over the full holding period. Many institutional investors set a minimum IRR threshold for warehouse projects to account for risk and illiquidity.
When modeling NOVA HUB, you can compare IRR for different assumptions about rent levels, vacancy, and exit cap rate, then select a scenario that matches your risk appetite.
Cash-on-cash return
Cash-on-cash return shows annual pre-tax cash flow relative to the amount of equity invested. This metric is especially useful if you use bank financing to acquire the warehouse unit, because it reflects the effect of leverage.
What matters most is that cash-on-cash helps you assess how much actual cash you receive each year compared to your own capital contribution, not the total project value.
📐 How to build a step-by-step ROI model for a warehouse complex
A structured model helps ensure that all important cost and revenue items are reflected. Below is a simplified workflow that can be adapted to NOVA HUB.
Step 1. Gather project data
Collect key parameters of the logistics center: total leasable area, average market rent per square meter, indexation rules, operating expense budget, and projected occupancy. You can use figures from the official characteristics, Odesa market studies, and conservative benchmarks from comparable assets.
At this stage, avoid overly optimistic assumptions. Use current market rent levels and a realistic time frame for full stabilization after commissioning.
Step 2. Estimate revenues
Project gross rental income by multiplying leased area by rent per square meter and adding potential income from additional services such as parking or office units. Then apply a vacancy rate to reflect periods when some space is not leased.
You should also include expected rent indexation, for example based on inflation or a fixed annual step-up, to model progressive income growth over time.
Step 3. Estimate operating expenses
Operating expenses cover maintenance, utilities for common areas, property management, insurance, property tax, security, and technical inspections. For a professionally run complex, some costs are recovered from tenants, while others remain the responsibility of the owner.
Deduct operating expenses from gross income to obtain net operating income (NOI). NOI is the core figure used in many ROI and valuation formulas for warehouse real estate.
Step 4. Model financing and exit
If you use debt, include interest payments and principal amortization. This allows you to calculate actual cash flow to equity. At the same time, plan several exit scenarios, for example a sale of the property in year 7 or 10 using different capitalization rates.
Bottom line, a robust model for NOVA HUB should include both operational cash flows and a realistic exit value to properly capture total return on investment.
⚖️ Pros and cons of investing in NOVA HUB
Every project, even a high quality one, has both strengths and constraints. A balanced view helps investors make informed decisions.
Advantages of the project
- Strategic location Close connection to the Odesa–Kyiv highway and dry port enhances tenant demand and long term occupancy stability.
- Modern European standards Contemporary construction quality, energy efficient design, and functional layouts increase operational efficiency for logistics clients.
- Professional management SK GROUP’s facility management reduces vacancy risk and ensures consistent maintenance of the asset.
- Transparent information Clear public data on project advantages, plan, and characteristics simplifies ROI modeling and risk assessment.
- Growth potential Logistics infrastructure in southern Ukraine has significant upside as trade flows recover and reorient.
Limitations and risks
- Country and regional risk Macroeconomic and geopolitical factors in Ukraine require higher expected returns compared to mature markets.
- Market volatility Rental rates and occupancy for warehouse space may fluctuate during periods of economic uncertainty.
- Liquidity Selling large logistics assets can take time, so investors need a medium to long term horizon.
- Construction and delivery timing For units under construction, delays may shift the start of income generation.
- Regulatory environment Changes in tax or regulatory frameworks may affect property costs or tenant demand.
📚 Example ROI scenarios for a NOVA HUB warehouse unit
To illustrate the mechanics, let us consider two fictional but realistic scenarios for an individual investor acquiring a unit in a warehouse complex.
Base parameters for the example
Assume an investor purchases 5,000 square meters of warehouse space in a modern logistics center near Odesa. The purchase price, including all acquisition costs, equals 900 USD per square meter, or 4.5 million USD total. Average achievable rent is 7.5 USD per square meter per month, with 5 percent vacancy and operating expenses equal to 25 percent of gross income.
The following table summarizes these starting parameters.
| Parameter | Value |
|---|---|
| Area acquired | 5,000 m² |
| Total investment | 4,500,000 USD |
| Average rent | 7.5 USD/m²/month |
| Vacancy rate | 5 % |
| Operating expenses | 25 % of gross income |
Scenario A. Unleveraged investment
In Scenario A, the investor uses only equity capital. Annual gross income is 5,000 × 7.5 × 12 = 450,000 USD. With 5 percent vacancy, effective gross income equals 427,500 USD. After subtracting 25 percent operating expenses, net operating income is approximately 320,625 USD.
Simple ROI is 320,625 ÷ 4,500,000, around 7.1 percent per year. If rents grow modestly and the asset appreciates, the all-in IRR over 10 years may reach higher double digits, depending on the exit cap rate.
Scenario B. Leveraged investment with bank financing
Scenario B assumes 60 percent bank financing at 8 percent interest with 20 year amortization. Annual debt service is about 412,000 USD. In the first years, cash flow to equity will be lower than NOI due to debt costs, but leverage magnifies the percentage return on the 40 percent equity stake.
Using the same income and cost parameters, equity cash flow in early years may reach 70,000 to 90,000 USD on 1.8 million USD of equity, which equals roughly 4 to 5 percent cash-on-cash. However, the leveraged IRR over 10 years, including loan amortization and potential sale, might exceed the unleveraged IRR, provided that rents and values grow as expected.
Scenario comparison
| Metric | Scenario A (No debt) | Scenario B (60 % debt) |
|---|---|---|
| Equity invested | 4,500,000 USD | 1,800,000 USD |
| Year 1 NOI | 320,625 USD | 320,625 USD |
| Year 1 equity cash flow | 320,625 USD | ≈80,000 USD |
| Simple ROI (Year 1) | ≈7.1 % | ≈4.4 % cash-on-cash |
| Risk profile | Lower financial risk | Higher, but with upside |
In short, leverage can increase long term IRR but also adds financial risk, which must be considered when evaluating the profitability of a warehouse complex in Odesa.
🚫 Common mistakes when calculating ROI for logistics centers
Even experienced investors can misjudge a project when they overlook critical details. Below are typical pitfalls related to ROI modeling for NOVA HUB type assets.
Overestimating achievable rent and speed of leasing
Some investors assume top-of-market rents for the entire area from day one. In reality, ramp-up periods and tenant negotiations may result in lower effective rates. This issue is especially relevant in markets with dynamic competition and evolving demand.
To avoid this, use latest market data from Odesa and apply moderate rent assumptions, with a lease-up period before reaching stabilized occupancy.
Ignoring vacancy and downtime between tenants
Even in high quality projects, there are transitions between tenants and occasional short term vacancies. Models that assume 100 percent occupancy for all years will overstate NOI and IRR.
A practical approach is to use at least 3 to 7 percent structural vacancy in your base case, even if the asset historically performs better.
Underestimating operating and capital expenditures
Another frequent error is to underestimate maintenance, insurance, property taxes, and periodic capital upgrades. Understated costs artificially inflate profitability indicators.
Investors should distinguish between regular operating expenses and irregular capital expenses such as roof repairs or dock equipment replacements and reflect both in the model.
Not including exit value or exit costs
Some analyses consider only annual income and ignore potential asset sale or refinancing. Others include exit proceeds but forget transaction costs and taxes. Both approaches distort IRR and NPV.
A balanced model includes a realistic exit cap rate, expected sale price, and all associated costs such as brokerage, legal fees, and taxes.
Using unrealistic discount rates
If the discount rate in NPV calculations is too low, any project will look attractive. If it is too high, nearly nothing will pass the filter. Investors sometimes mechanically apply rates from foreign markets that do not match Ukrainian risk reality.
The key takeaway is that discount rates must reflect both macro risk of Ukraine and micro risk of the specific asset, including construction, leasing, and liquidity factors.

🧰 Practical tips for evaluating NOVA HUB’s payback and profitability
Clear and disciplined practice can significantly improve the quality of your decision making.
Use conservative base cases and optimistic upside cases
Prepare at least three scenarios: conservative, base, and optimistic. In conservative mode, apply lower rents, longer lease-up, and slightly higher vacancy. In the optimistic scenario, reflect faster absorption and stronger market growth.
Comparing these side by side will show how sensitive ROI for the NOVA HUB logistics center is to each assumption.
Benchmark against other Odesa warehouse projects
Analyze comparable assets in the Odesa region in terms of rent, occupancy, construction quality, and location. This helps you validate whether NOVA HUB’s parameters support the target profitability and if any premium is justified.
Independent market reports, brokers, and logistics operators can offer insight into current and expected demand for dry port related warehouse capacity.
Factor in the benefits of online construction monitoring
NOVA HUB provides tools to monitor construction progress online. This level of transparency reduces development risk because investors can follow each stage of building and fit-out.
From a financial perspective, better control over deadlines and quality reduces the probability of unexpected cost overruns and delays in the start of rental income.
Align holding period with your capital strategy
Decide in advance whether you plan to hold the asset for income, exit after stabilization, or combine both strategies. The chosen horizon affects which metrics matter most. Long term holders focus on stable NOI and low vacancy, while value-add investors pay more attention to IRR at exit.
Bottom line, a clear exit or hold strategy makes ROI calculations more meaningful and easier to compare with other investment opportunities.
Verify documentation and technical compliance
Ensure that all project documents, permits, and technical specifications meet Ukrainian regulations and European standards. This is important both for minimizing legal risk and for securing bank financing on favorable terms.
Checking this early also influences future liquidity, because institutional buyers typically require fully compliant assets when acquiring larger portfolios.
📈 Market context: why logistics investment in Ukraine and Odesa matters now
Understanding the broader market picture helps place project level ROI in context and supports long term expectations.
Reconfiguration of supply chains
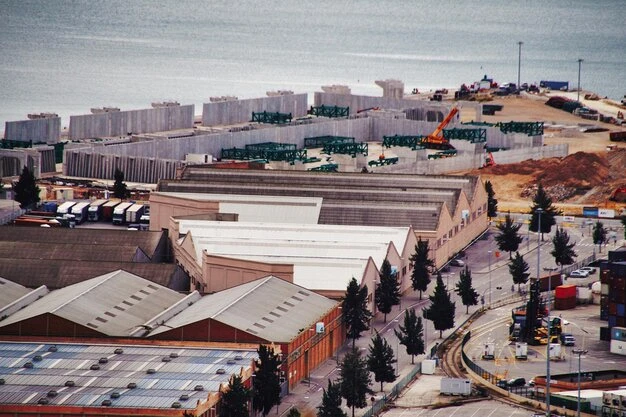
Ukraine’s logistics infrastructure is undergoing structural change as export and import flows adapt to new routes, including greater reliance on road and rail corridors that connect to Black Sea ports and European hubs. Odesa plays a key role in these routes thanks to its historic port functions and multimodal connectivity.
As trade corridors stabilize, modern warehouse facilities along these routes become essential nodes that support storage, consolidation, and distribution for regional and international shippers.
Growing demand for modern class A warehouses
Market research from international consultancies consistently shows that tenants prioritize quality, safety, and efficiency in warehouse spaces. Older facilities without proper clear height, dock capacity, or energy efficiency often struggle to compete with new class A developments.
According to a 2023 report by an international real estate advisory firm, modern logistics space in Eastern Europe has shown significantly lower vacancy and faster rent growth than outdated stock, even during periods of economic volatility.
— Regional Logistics Property Outlook, 2023
This pattern also applies to the Odesa region, where modern hubs that meet European standards are well positioned for long term absorption.
Professionalization of asset management
The presence of experienced developers and managing companies such as SK GROUP indicates a trend toward professionalization of logistics real estate. Investors benefit from more transparent reporting, better maintained assets, and improved communication with tenants.
To summarize, macro trends support a positive long term outlook for well located, modern warehouse complexes, which enhances the strategic case for projects like NOVA HUB.
✅ Conclusion: is NOVA HUB likely to deliver strong payback for investors?
Based on its strategic Odesa–Kyiv location, modern European-standard design, and professional management, NOVA HUB has many ingredients needed for sustainable ROI. When investors build rigorous models that include realistic rents, vacancy, costs, and exit scenarios, payback periods can be competitive with other regional logistics assets, especially under conservative assumptions.
At the same time, the project is exposed to general Ukrainian market risks, so discount rates and target IRR should reflect this reality. Investors who combine prudent modeling with a medium to long term horizon are best positioned to benefit from the profitability of a warehouse complex in this corridor.
As the festive season approaches, many investors rethink their portfolios and plan next year’s projects. If you are considering adding high quality logistics real estate to your assets, explore how NovaHub can align with your strategy and bring you closer to your financial goals. Feel the spirit of Christmas optimism, review the project details on the official website, and discuss tailored options with the team to start the new year with a strong, well structured logistics investment.
Sources
— Regional Logistics Property Outlook (2023)
— Statista Research on European Logistics Real Estate (2024)
— McKinsey Global Institute, Infrastructure and Logistics Report (2022)
— JLL Eastern Europe Logistics Market Overview (2023)
— CBRE Industrial and Logistics Market View (2023)
FAQ in English (USA)
How is simple ROI for a NOVA HUB unit calculated in the example?
In the example, the investor buys 5,000 m² for 4.5 million USD and receives approximately 320,625 USD in net operating income per year. Simple ROI equals NOI divided by total investment, which is about 7.1 percent annually, not including future rent growth or asset appreciation.
Why is the Odesa–Kyiv corridor important for NOVA HUB’s profitability?
The Odesa–Kyiv corridor connects a major port city with the capital and key inland markets. Being close to this route and a dry port supports strong tenant demand, higher occupancy, and more stable rents, which directly improve ROI for the NOVA HUB logistics center compared with less connected locations.
What are the main advantages of investing in NOVA HUB compared with older warehouses?
NOVA HUB offers modern European-standard construction, efficient layouts, and professional management by SK GROUP. These features usually result in better operational efficiency for tenants, lower vacancy, and more predictable expenses than older, outdated warehouses, which improves long term investment performance.
Which ROI metrics should I prioritize when evaluating NOVA HUB?
You should look at several indicators together, including simple ROI, payback period, NPV, IRR, and cash-on-cash return. For long term investors, NPV and IRR over a 7 to 10 year horizon are especially important because they reflect both annual income and the eventual sale of the asset.
How can I avoid overestimating rental income in my model?
Use current market rent levels for comparable Odesa logistics projects rather than best case asking rents. Include a lease-up period and at least 3 to 7 percent structural vacancy. Building conservative, base, and optimistic scenarios side by side helps you see how sensitive ROI is to rental assumptions.
What common costs do investors forget when modeling NOVA HUB payback?
Investors often underestimate operating costs such as maintenance, insurance, property tax, and security, or they ignore periodic capital expenditures like major repairs. Some also forget transaction and tax costs at exit. Including both regular and irregular expenses provides a more realistic profitability picture.
How does bank financing change the ROI profile of a NOVA HUB investment?
Financing increases potential IRR by allowing you to control a larger asset with less equity, but it also adds debt service obligations and financial risk. In the example, leverage reduces early cash-on-cash return to about 4 to 5 percent, yet can raise long term IRR if rents and values grow as projected.
Why is online construction monitoring relevant for ROI?
Online monitoring tools improve transparency and help ensure that construction stays on schedule and within budget. Fewer delays mean earlier rental income and less risk of cost overruns, both of which support a stronger and more predictable return on investment.
What holding period is reasonable for a NOVA HUB investment?
Given the nature of logistics real estate and the Ukrainian market environment, many investors consider a 7 to 10 year horizon appropriate. This allows time for lease-up, stabilization, rent growth, and an orderly sale, which together shape the IRR and NPV of the investment project in Odesa.